Kibana is a powerful visualization platform designed specifically for log management with Elasticsearch. It already provides a lot built-in, but its open-source nature obviously lends it to some pretty cool simple and complicated additions from its community of devs. Some favorites include adding certain kinds of visualizations, API attachments, better integration between Kibana and other platforms, as well simple add-ons for flair in reports. Here are 14 open-source Kibana plugins that you can find through GitHub that are compatible with at least Kibana 7.x. If you have any other suggestions, feel free to please add descriptions and links in the comments below.
What to remember about up-to-date Kibana plugins
This list is composed of Kibana plugins that are compatible with all 7.x versions of the ELK Stack. When searching for open source plugins, remember some might not be (immediately) compatible with the latest versions of Kibana and the whole Elastic Stack overall. In the future, we hope to update this list for reference. When necessary, we will mark compatibility, assuming future versions of the Elastic Stack make it an issue.
Country Flag FieldFormat
This will add some color to your charts by adding the banner of countries when you filter be geoid.country. This uses flag-icon-css at its core.This is a purely cosmetic change, but that’s what visualization is for, right? Adding country flags makes it easier for a lot of people to sift through large chunks of data in the blink of an eye, even if you prefer to keep things organized by text rather than pies and bar graphs.Installation is simple, while it will be necessary to update formatting in Management>Index PatternsNo word yet on state, provincial or city flags, but that’s probably an issue for Unicode.
_analyze API
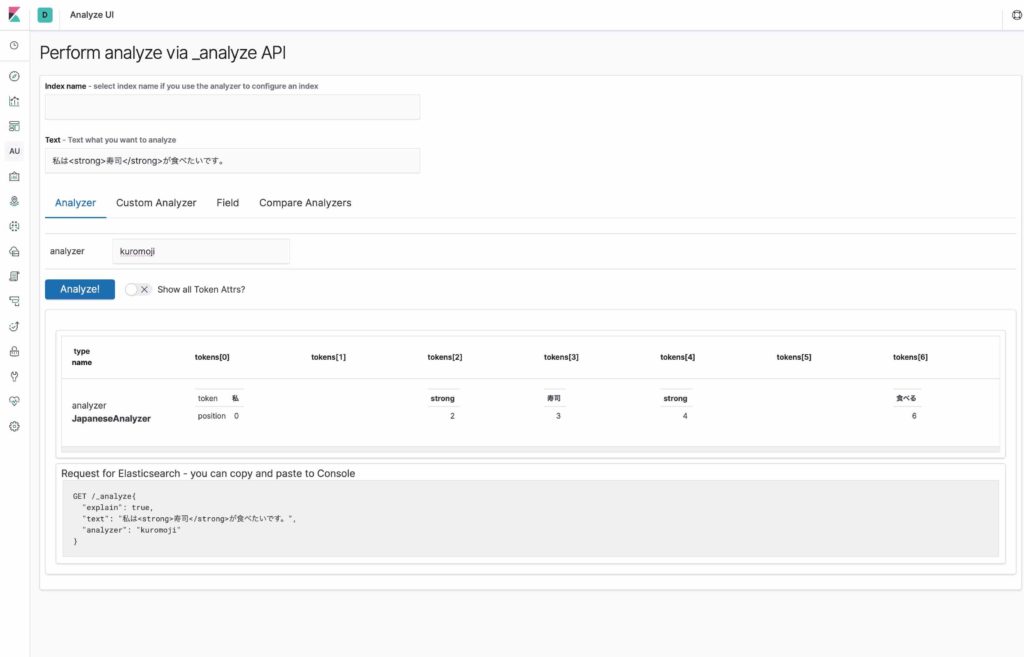 Screenshot of the _analyze API UI
This plugin is meant to create a simpler, more understandable UI for Elasticsearch’s _analyze API. Of course, you can input a custom analyzer process of text, a character filter, a tokenizer and token filter. To add additional filters to the analyzer, just tap the plus button. By default, it will only display basic info about tokens, but you can automatically display more advanced parameters by pressing the Show all Token Attrs? Button.
The best part? You can compare the results of different analyzers, allowing you to compare different custom mockups with each other or the built-in standards of Elasticsearch.
ElastAlert
This plugin was created by the team at Yelp that relies on the ELK Stack to fill the gap left by a lack of alerts in the stack. It is supposed to be “highly modular and easy to set up and configure (at least according to the ElastAlert docs). It supports at least a dozen alert types (JIRA, Slack, Telegram, Stomp, Command, SNS, Email, OpsGenie, GoogleChat, SNS, Debug, and theHive). Alerts link back to Kibana dashboards and add alerts to reports.
Sankey Visualizations
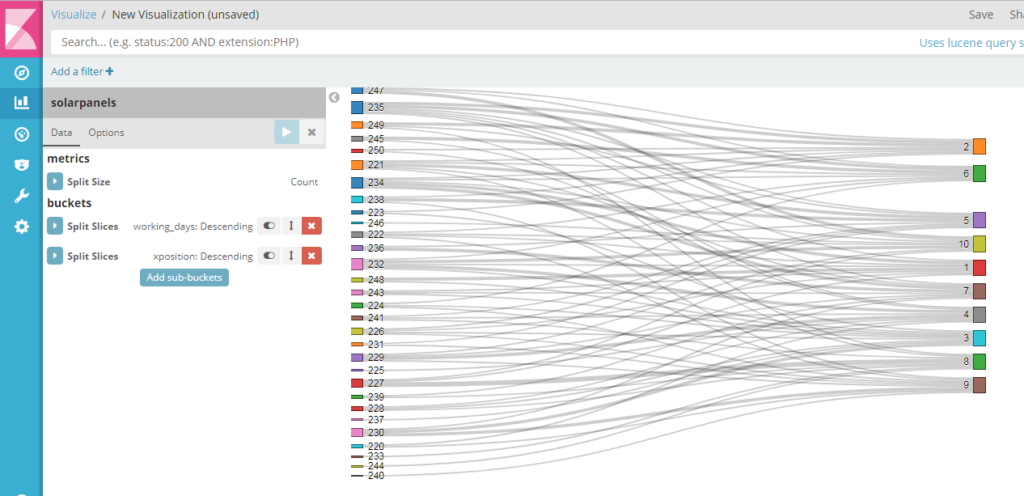
This example is taken from Kibana 5.x, but the sankey visualization plugin is also suited for all later versions.
This adds a sankey diagram option to Kibana. You’re mostly familiar with sankey if you ever follow the user path of site visitors in Google Analytics, or peruse through the free reports for SimilarWeb and its diagrams of sites providing incoming traffic and sites providing outgoing traffic. This can be extremely helpful in visualizing trends in traffic flow.
Keycloak
Keycloak is another option for restricting access to certain dashboards (in addition to nginx and xpack security). It delegates authorization and authentication whose developers claim is technology agnostic. It utilizes an HTTP(S) proxy in front of any apps that don’t have built-in authentication. It requires the creation of user roles, assignment of users to designated roles, and the addition of a new Kibana client. More details are available from Keycloak’s docs.
Enhanced Table
Kibana visualization like a Data Table, but with enhanced features like computed columns and filter bar. This adds advanced features to Kibana data tables, namely a number of capabilities in computed columns as well as another filter bar.
With the plugin, columns will support HTML, pretty formats for numbers and dates, column alignment and referencing for other columns. The filter bar allows for case-sensitive filtering, simultaneous filtering as you type, and a filter highlighter among other things.
Kibana GDPR Compliance
No one can get enough of GDPR, especially ELK Stack developers. That’s why this plugin covering cookies and privacy that keeps things from syncing too much data with Kibana should spruce up your day (or at least alleviate any headaches you might later have doing business in Europe). These cookies acknowledge GDPR and are then approved by users with its conditions in mind.
Milestones Visualization
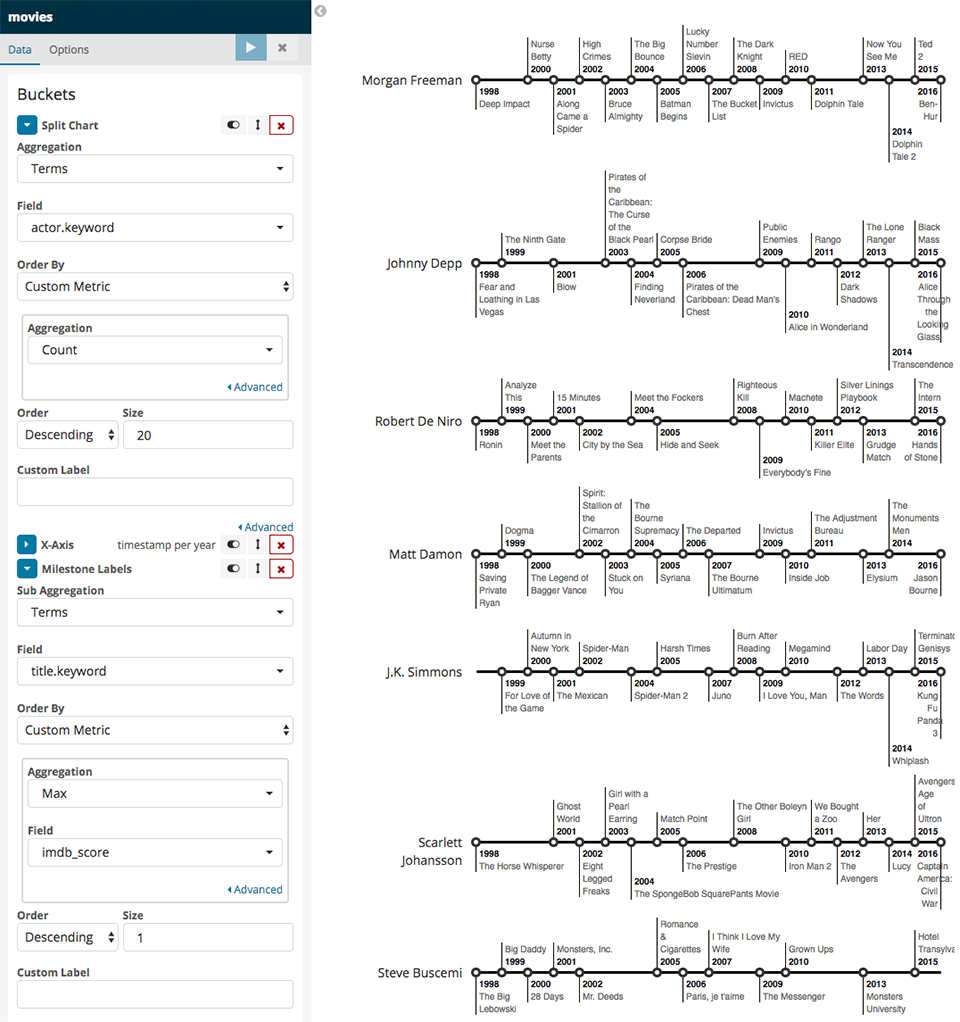 Visualize milestones on a timeline in Kibana
While the name might be self-explanatory, you have to see it to believe it. This Kibana plugin is a wrapper designed for the d3-milestones library (also repo’ed on GitHub). It will come up as ‘Milestones’ under Time Series options. Additionally, it allows grouping by quarter as a client-side custom aggregation, which isn’t natively available in Elastic. There are some basics that aren’t available (as of this writing) but are on their to-do list, such as horizontal-vertical view switching and more precise label placement.
Mithril
This nodejs/hapi Kibana plugin adds two-factor authentication to Kibana dashboards. Specs-wise, it’s written in node.js for the HAPI framework. At first log-in, you are directed to use Google Authenticator on a given QR Code. It’s applicable for LDAP and MongoDB
Prometheus-Exporter
This brings the metrics tracking of Prometheus into Kibana, if you’re into that sort of thing. If you prefer Kibana or just want to streamline things without having to open Grafana, then this is the plugin for you (although Logz.io is going to addressing this issue very soon).
As a bonus, the developer PJ Hampton doesn’t accept financial contributions and wants to direct anything you’d give them over to a charity for abandoned puppies (“Assisi NI, Dogs Trust and / or your local guide dog charity”). Nice.
Swimlane Visualization
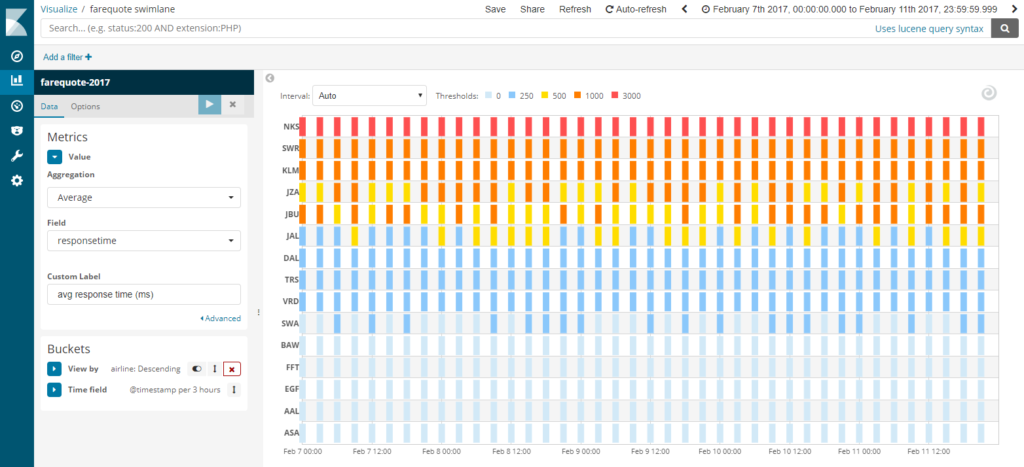
The swimlane visualization in Kibana tracks performance logs over time
This adds an option for creating a “swimlane” visualization into Kibana dashboards. Like lining up swimmers in different sections of a pool, you can track performance logs over time in comparison with other applications or application features.
This example below from the plugin’s GitHub repository shows a range of shortest to longest response times by airlines that are indexed on flight price comparison websites. To use the feature for this example, you would configure the Metrics value in Kibana with aggregation as Average and Field as responsetime. Additional parameters for bucket configurations are described in the GitHub repo. It also provides some deep and detailed options for colors based on ranges of values.
XLSX Importing
If you’ve ever wanted to smoothly import data from an Excel sheet (CSV or XLSX), then this one should concatenate your emotions. It provides an easy interface for selecting not just the file, but a sheet (or sheets) within a file. There are also advanced JSON options for further mapping customizations.
Logtrail
Logtrail is inspired by Papertrail but designed for Kibana to search through tail log events. It provides a live feed, color codes for values and highlighting search matches. It allows continued use of Beats or Fluentd to ship logs to Elasticsearch while mapping fields by Logtrail.
Searchbox
Searchbox is a UI to make Kibana management a lot smoother. It completes complete with a completion suggester and Type-As-You-Go (TAYG) functionality (i.e. autocomplete). There is also a custom search function and quick test analyzer.
WaferMap
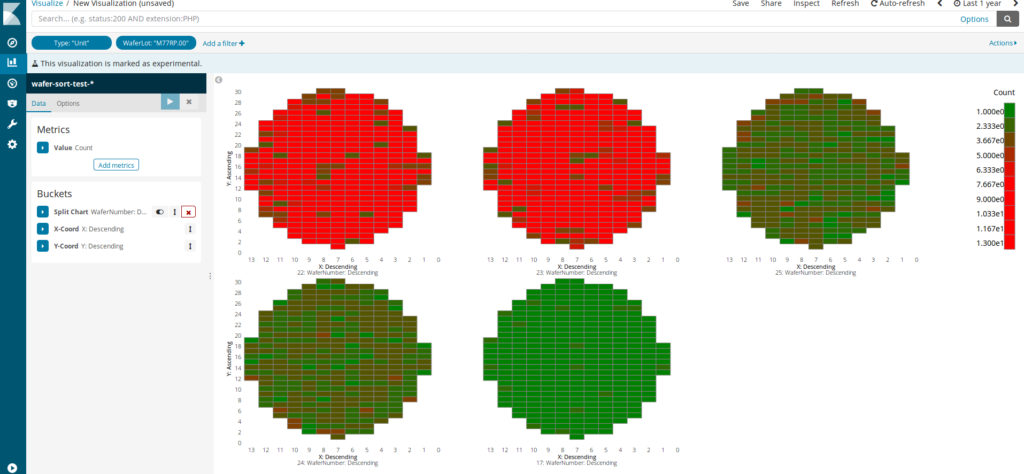
WaferMap adds, well, a wafer map (a.k.a. substrate map) option in Kibana
This plugin adds wafer map (or substrate map) visualization to Kibana with support for various shades of colors. In includes Plotly and SVG/Canvas chart types. This is particularly useful when tracking the performance of semiconductors. he Readme file outlines a few limitations in color selection.
More to Come
These are just a few of the open source options out there. There are still many more kinds of visuals and Kibana is continuously experimenting with its own built-in options (such as Vega and Controls in Version 7.x).
Автор: Resdeni

